Daily-refreshed delivery data, verified impressions, and demographic reporting, all in one dashboard, all on a methodology you can show your clients.
Book a Demo


Most OOH audience segments are built from rough proximity, not physics. StreetMetrics uses a physics-based Display Exposure Zone, a geometry calculated from each unit's dimensions, height, facing, and environmental factors. The viewshed is further refined based on historical outcome data. If a device wasn't in a position to see the ad, it doesn't count.
That's not just more accurate. It's a methodology your clients can audit.
Reconcile planned and delivered impressions using the same methodology across every format type and market. When numbers don't match, the system surfaces the discrepancy. No more manual reconciliation, no more defending a gap you can't explain.
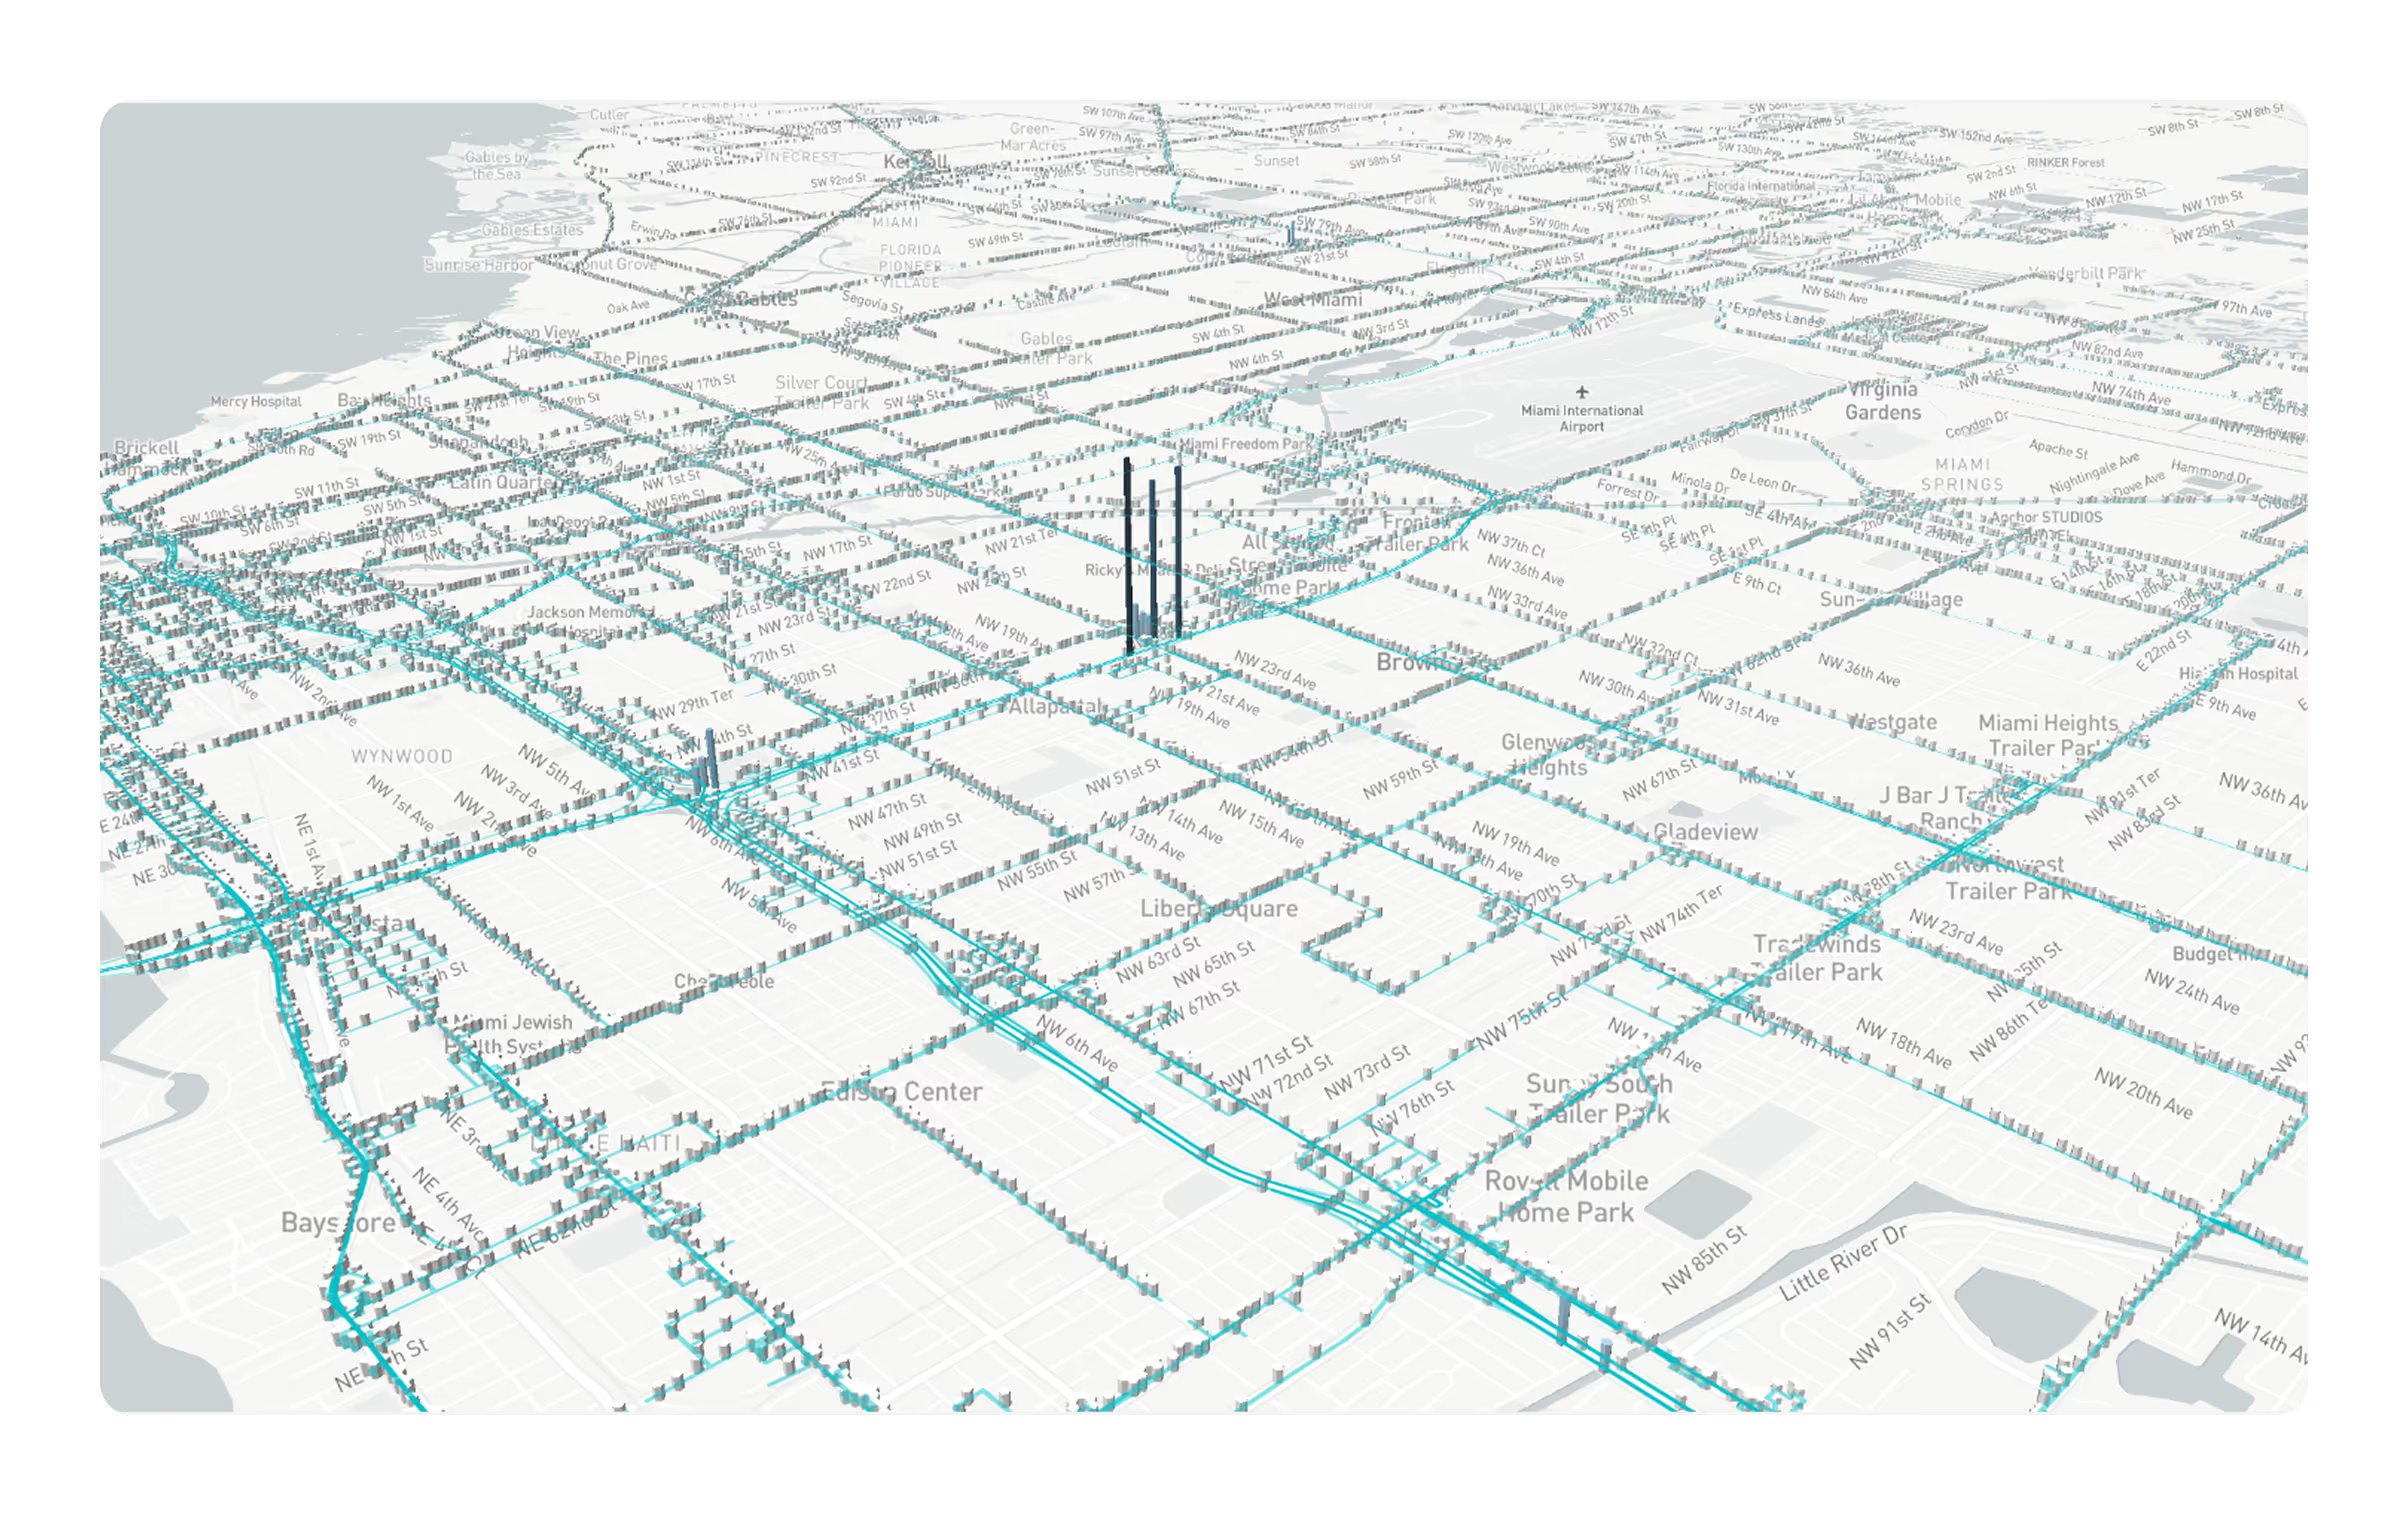
StreetMetrics verifies OOH ad delivery using GPS-tracked route data across 1B+ miles of coverage. Know when your creatives ran, where, and for how long, with proof-of-delivery documentation that survives any client or billing review.
Delivery data tied to demographic profiles, so you can tell clients who saw the campaign, not just how many people walked by. Age, income, gender, ethnicity, and behavioral segments are applied at the device level using the same mobility data that powers impression counting.